Value Viewer
This viewer displays value pairs for two header keys for each image. Value pairs that occur more than once are scaled (by default) in size and color. There are multiple options to reduce what is displayed and to modify the display style.
Usage
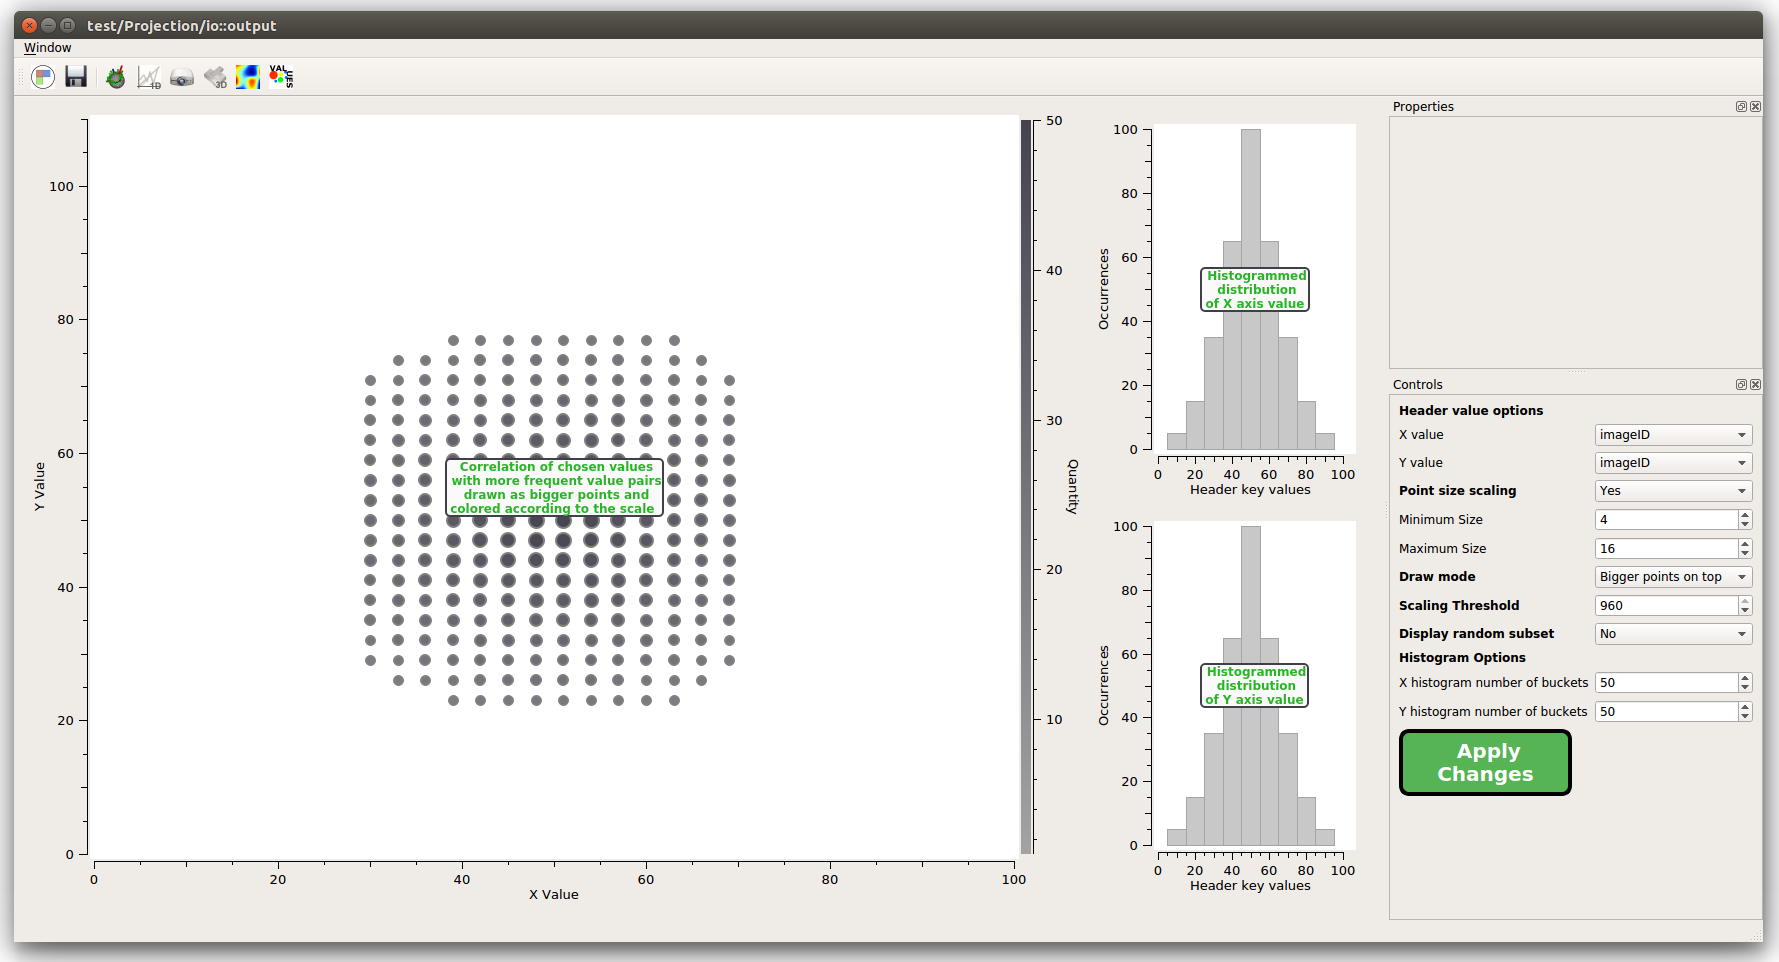
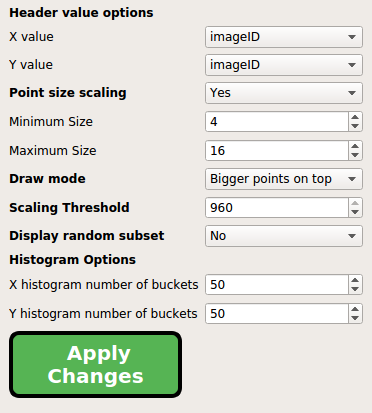 After opening the Main Viewer switch to the Value Viewer and select the X and Y values in Header value options. After applying this the 3 graphs will be plotted. In the option point size scaling, the diameter of the circles can be set. In Draw mode it is possible to differentiate between bigger or smaller points plotted on top. This is important for points, which lay on the same position. To display a random subset of the data set select Yes in the drop down menu and apply the changes. Additionally, the histograms can be adjusted in their bucket size.
After changing any option it is necessary to push Apply changes.
After opening the Main Viewer switch to the Value Viewer and select the X and Y values in Header value options. After applying this the 3 graphs will be plotted. In the option point size scaling, the diameter of the circles can be set. In Draw mode it is possible to differentiate between bigger or smaller points plotted on top. This is important for points, which lay on the same position. To display a random subset of the data set select Yes in the drop down menu and apply the changes. Additionally, the histograms can be adjusted in their bucket size.
After changing any option it is necessary to push Apply changes.
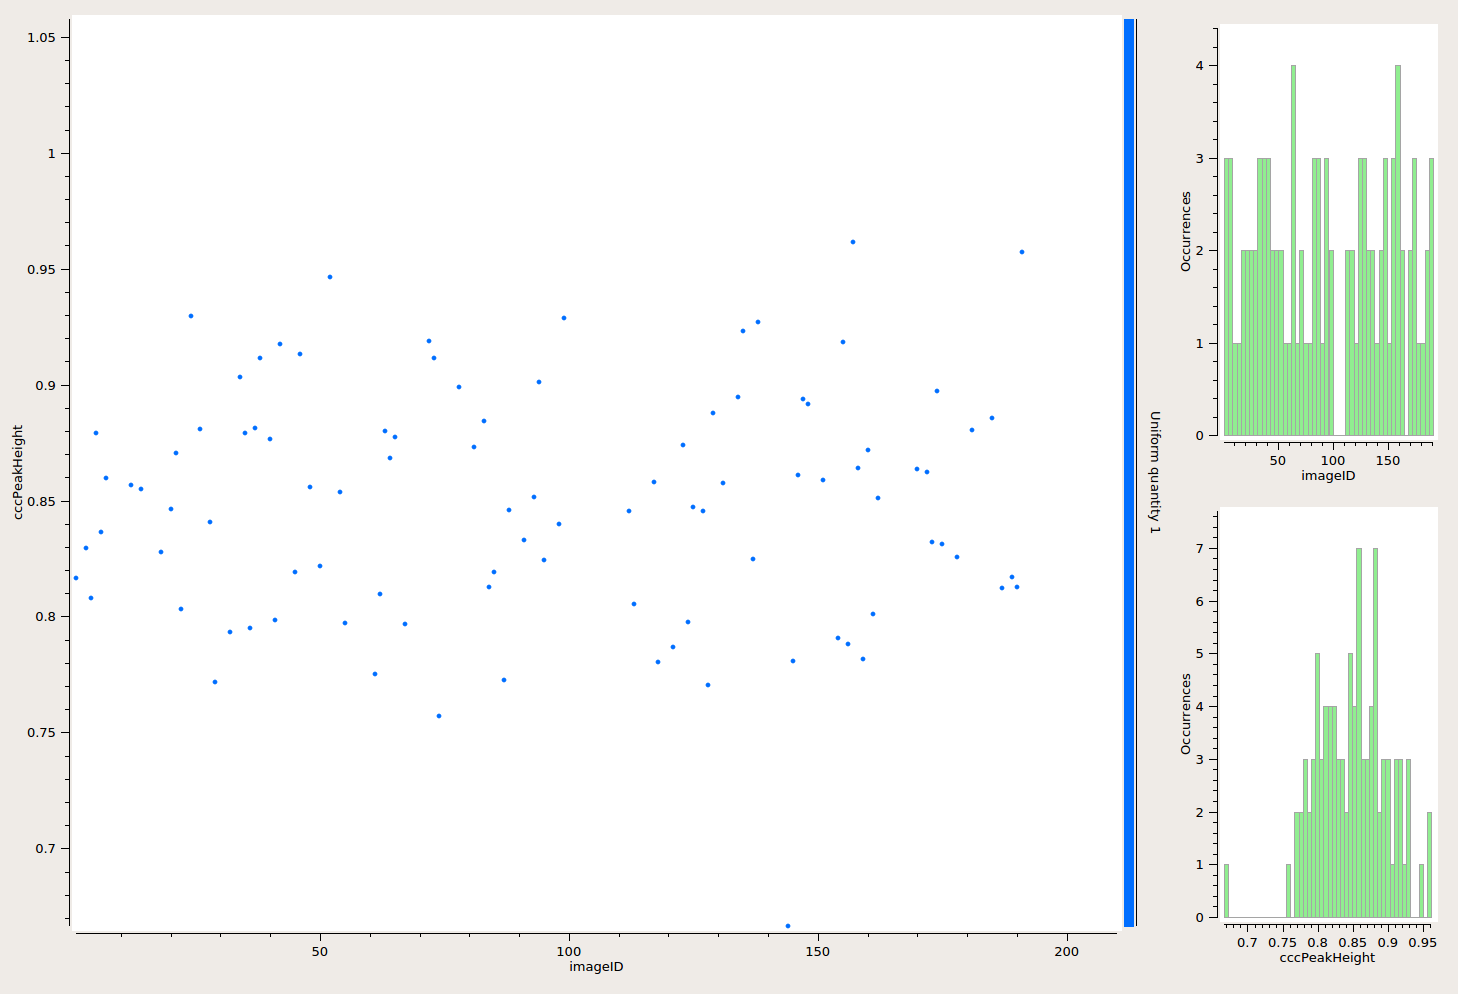
Example