This is an old revision of the document!
Value Viewer
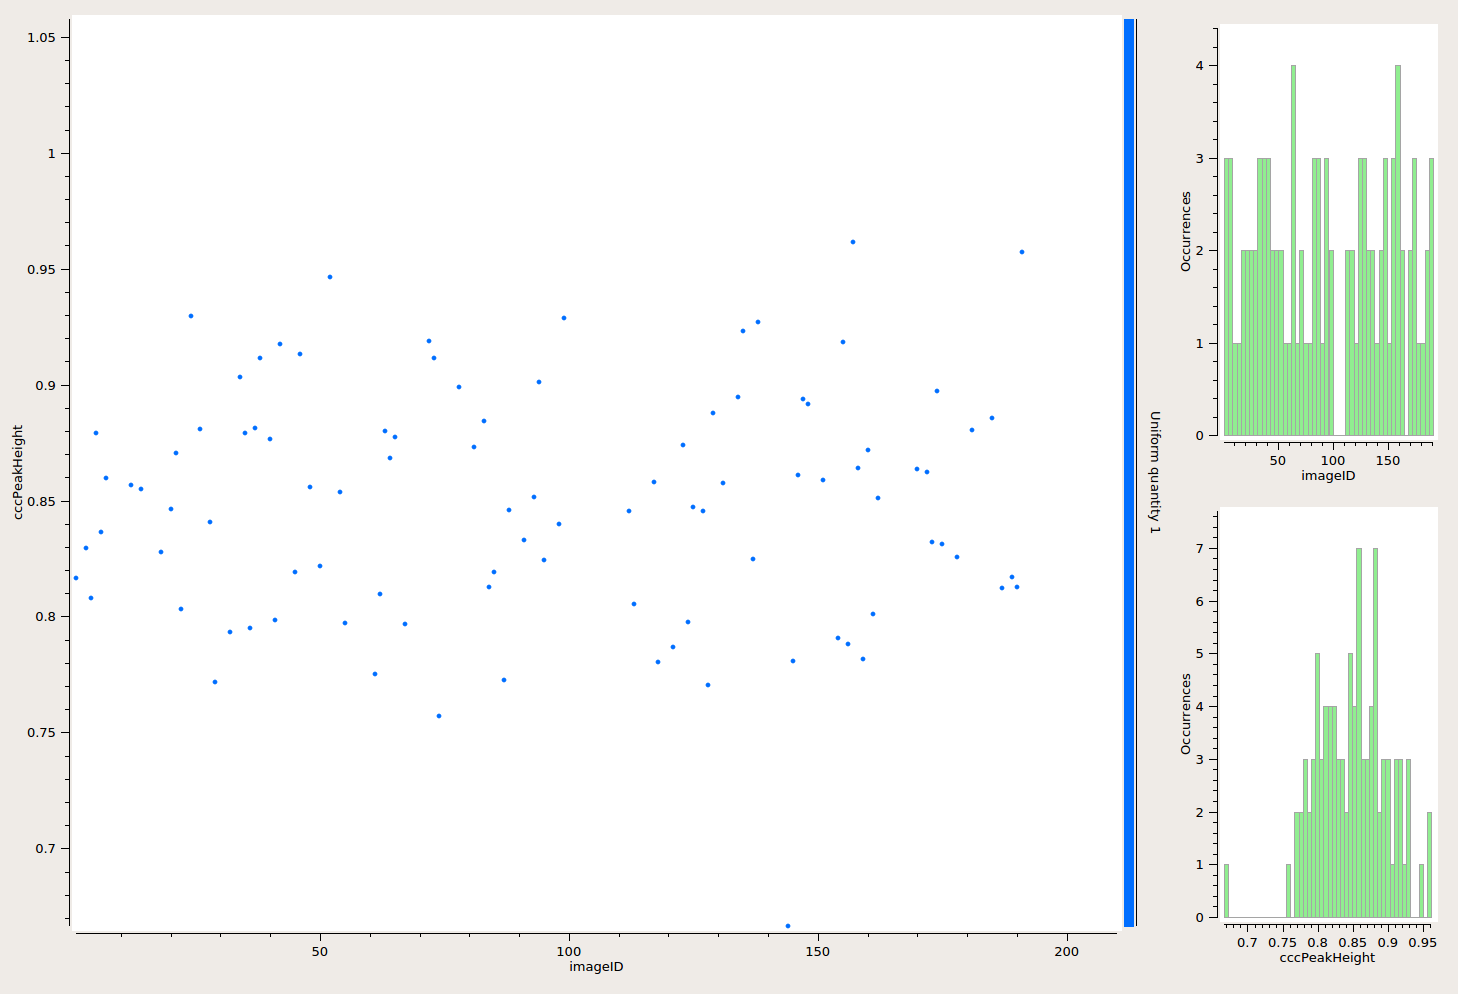
The Value viewer plots different header values against each other.
Usage
After opening the Main Viewer switch to the Value Viewer and select the the X and Y value in Header value options. After applying the 3 graphs will be plotted. There are options such as point size scaling or draw mode. Additionally, the histograms can be adjusted in their bucket size.
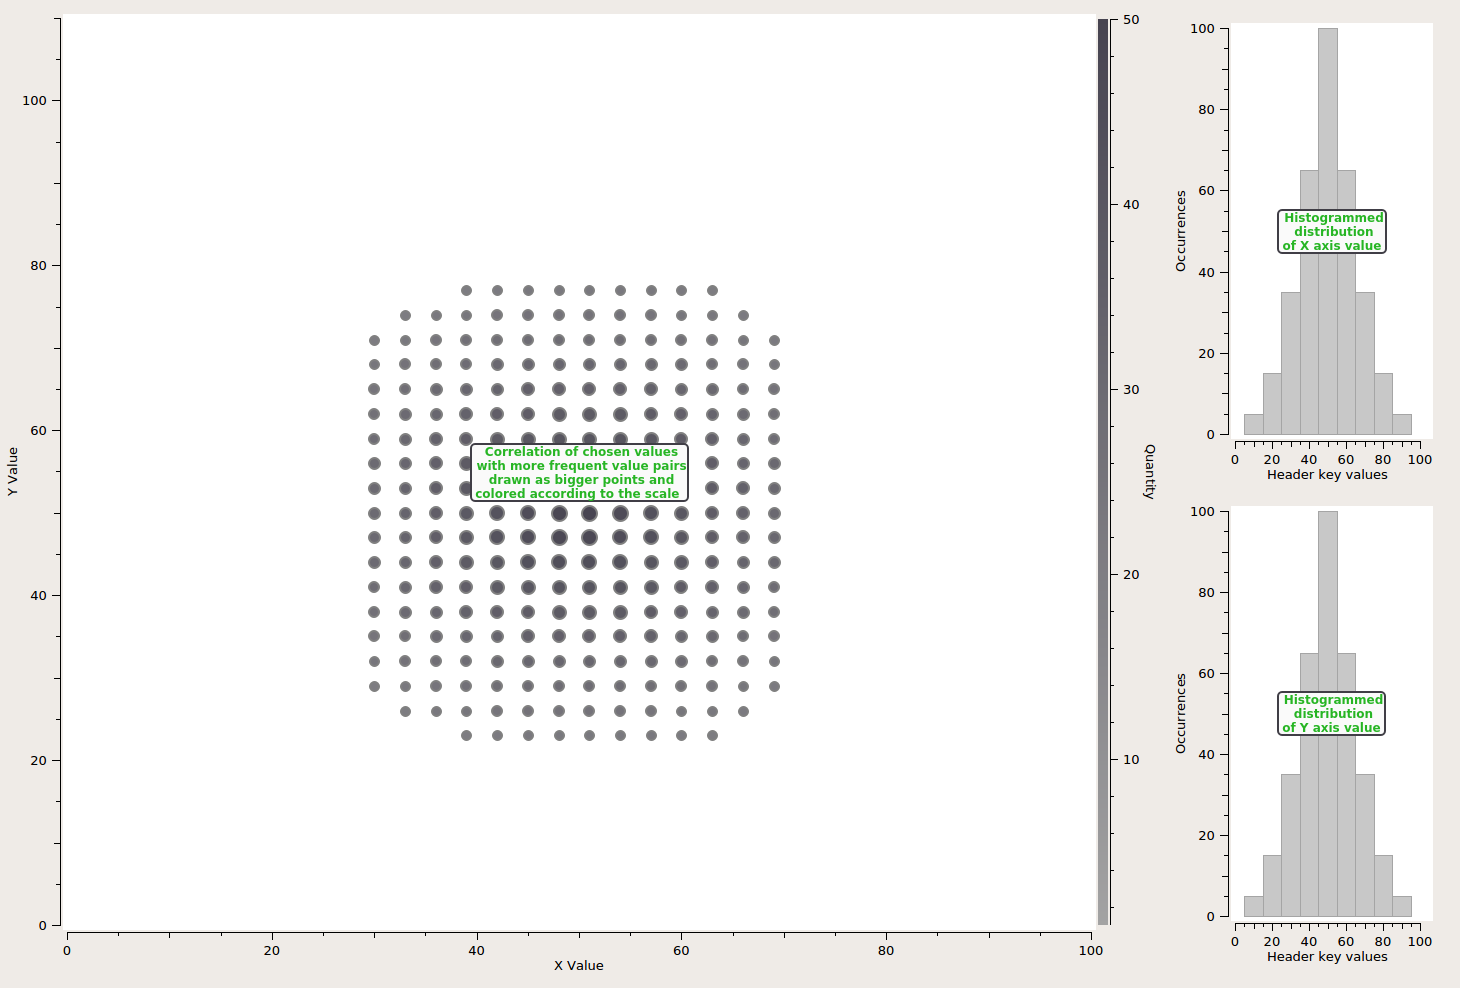
Example